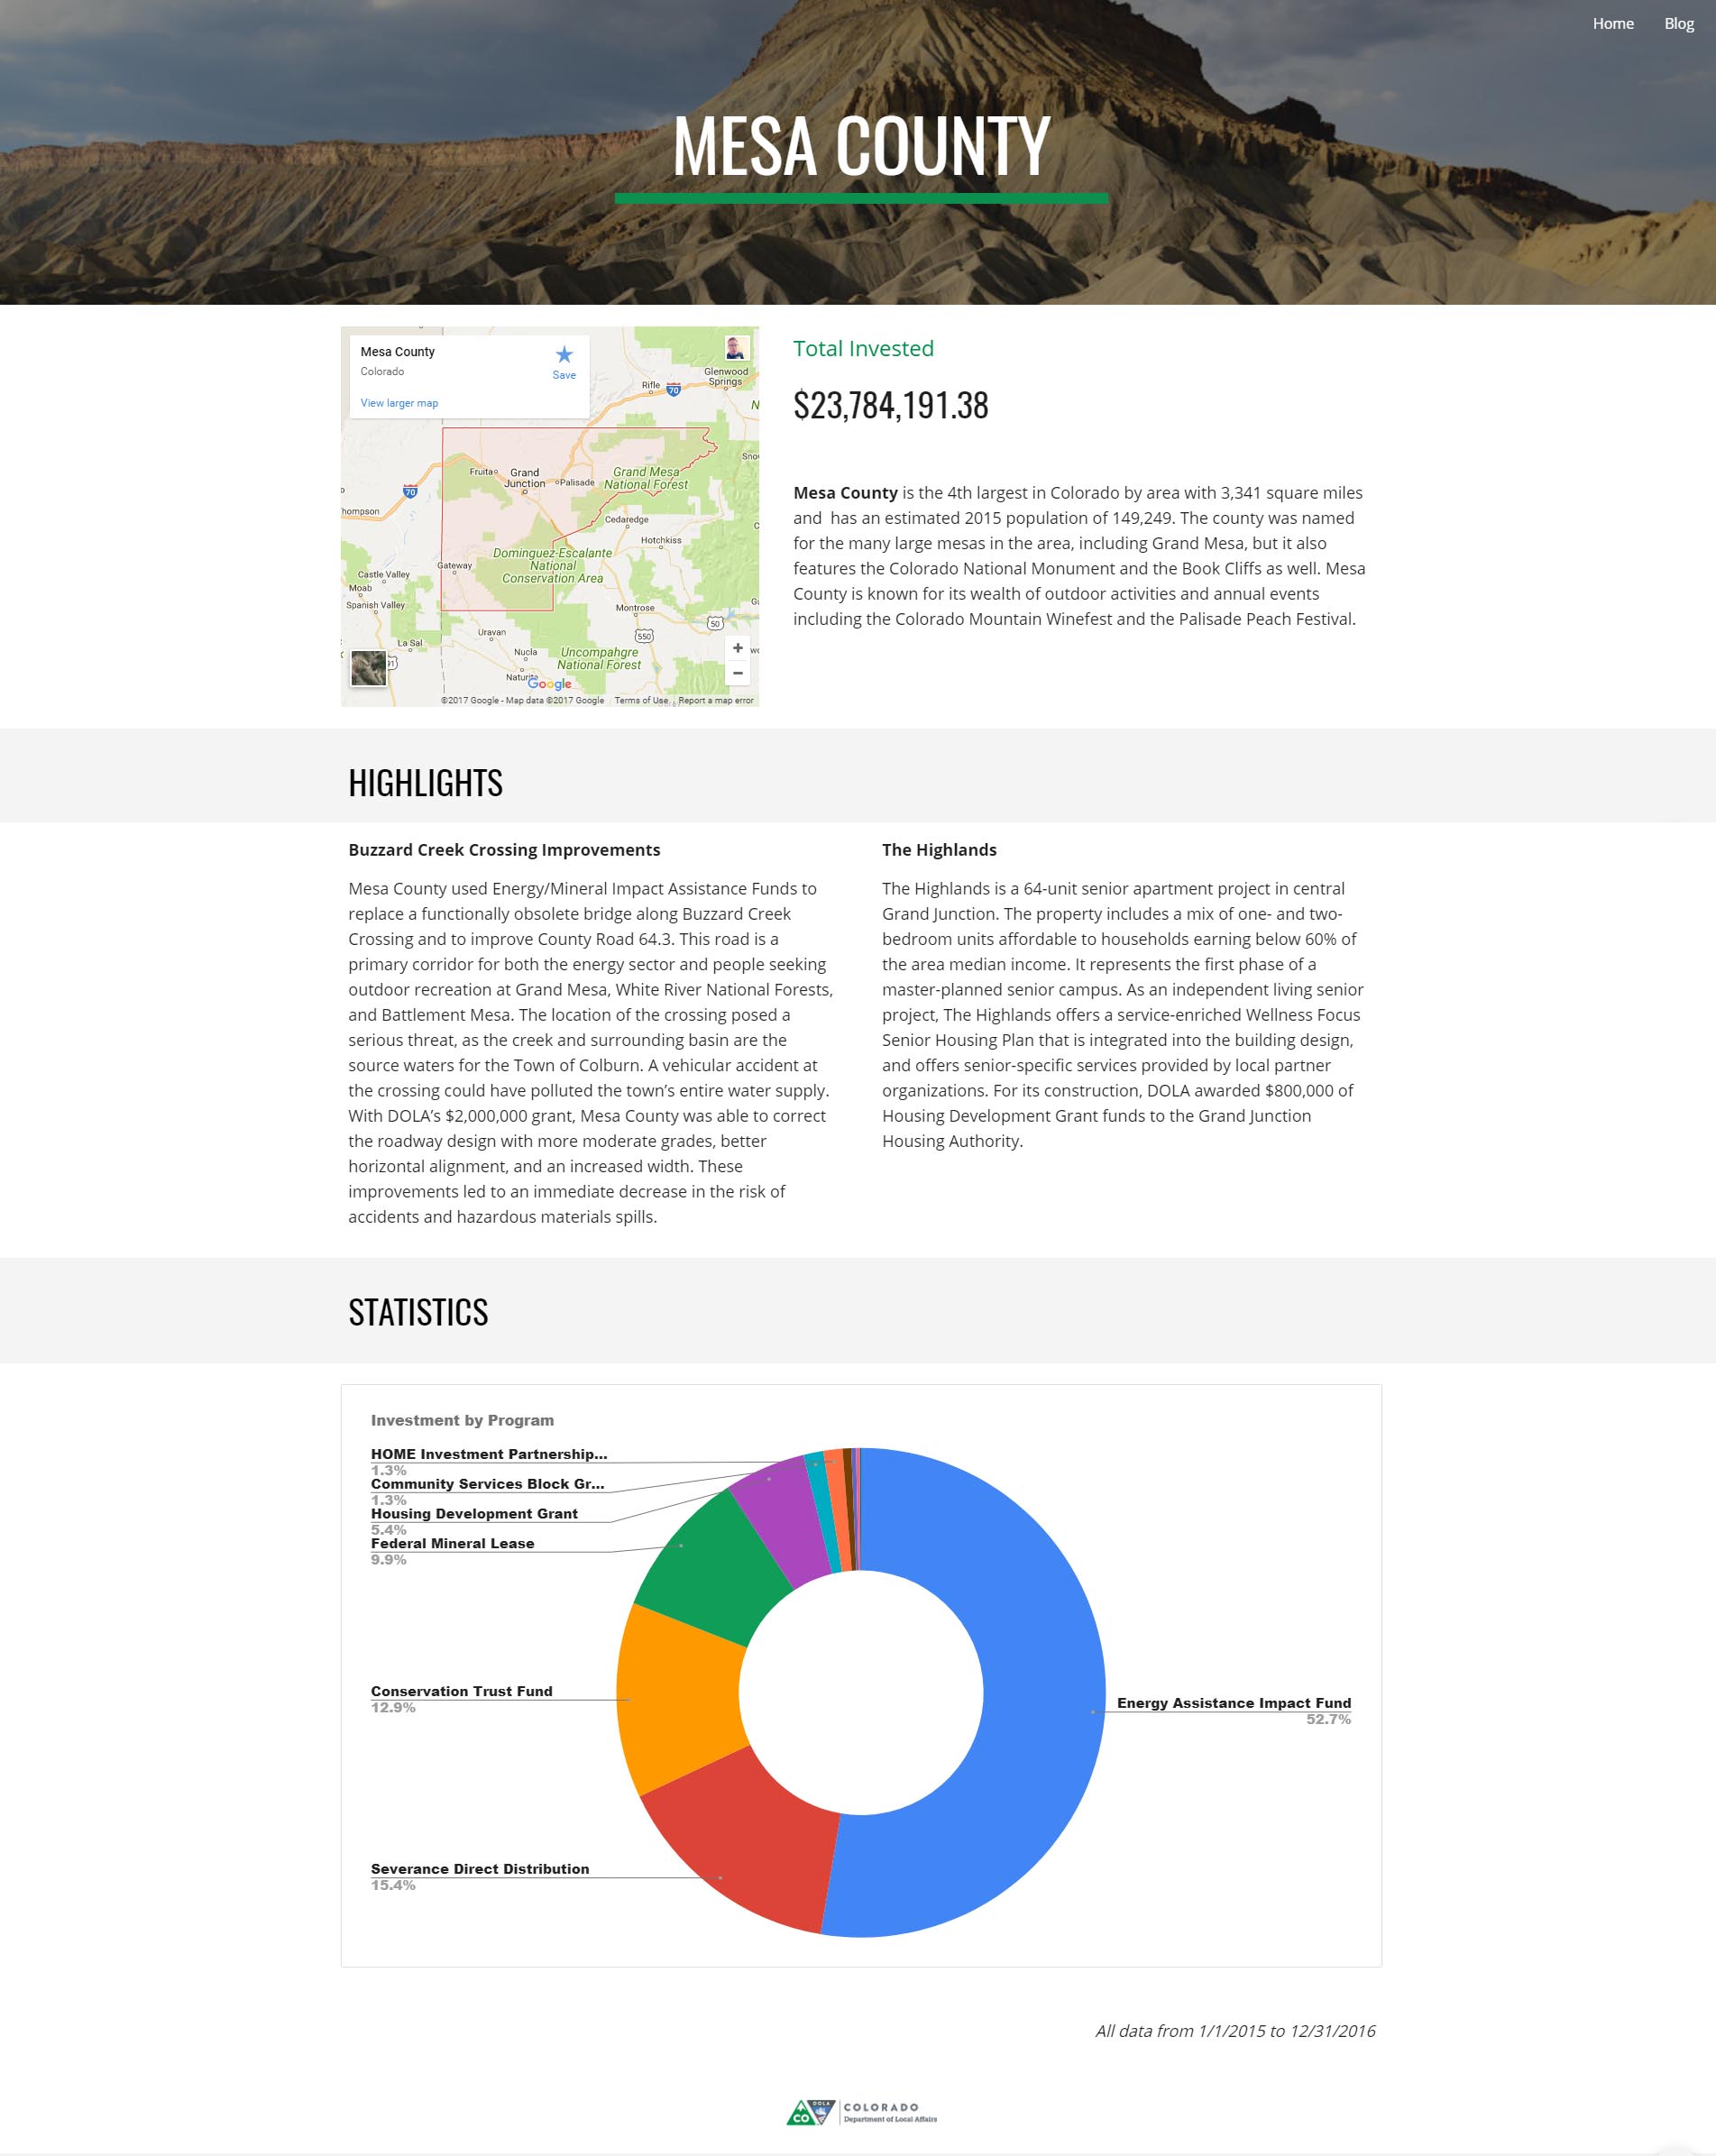
- A tool that showed exactly what programs at the Department of Local Affairs gave grants to specific Colorado counties - something that helped our executive director know our financial impact as he traveled the State meeting with leaders in each county
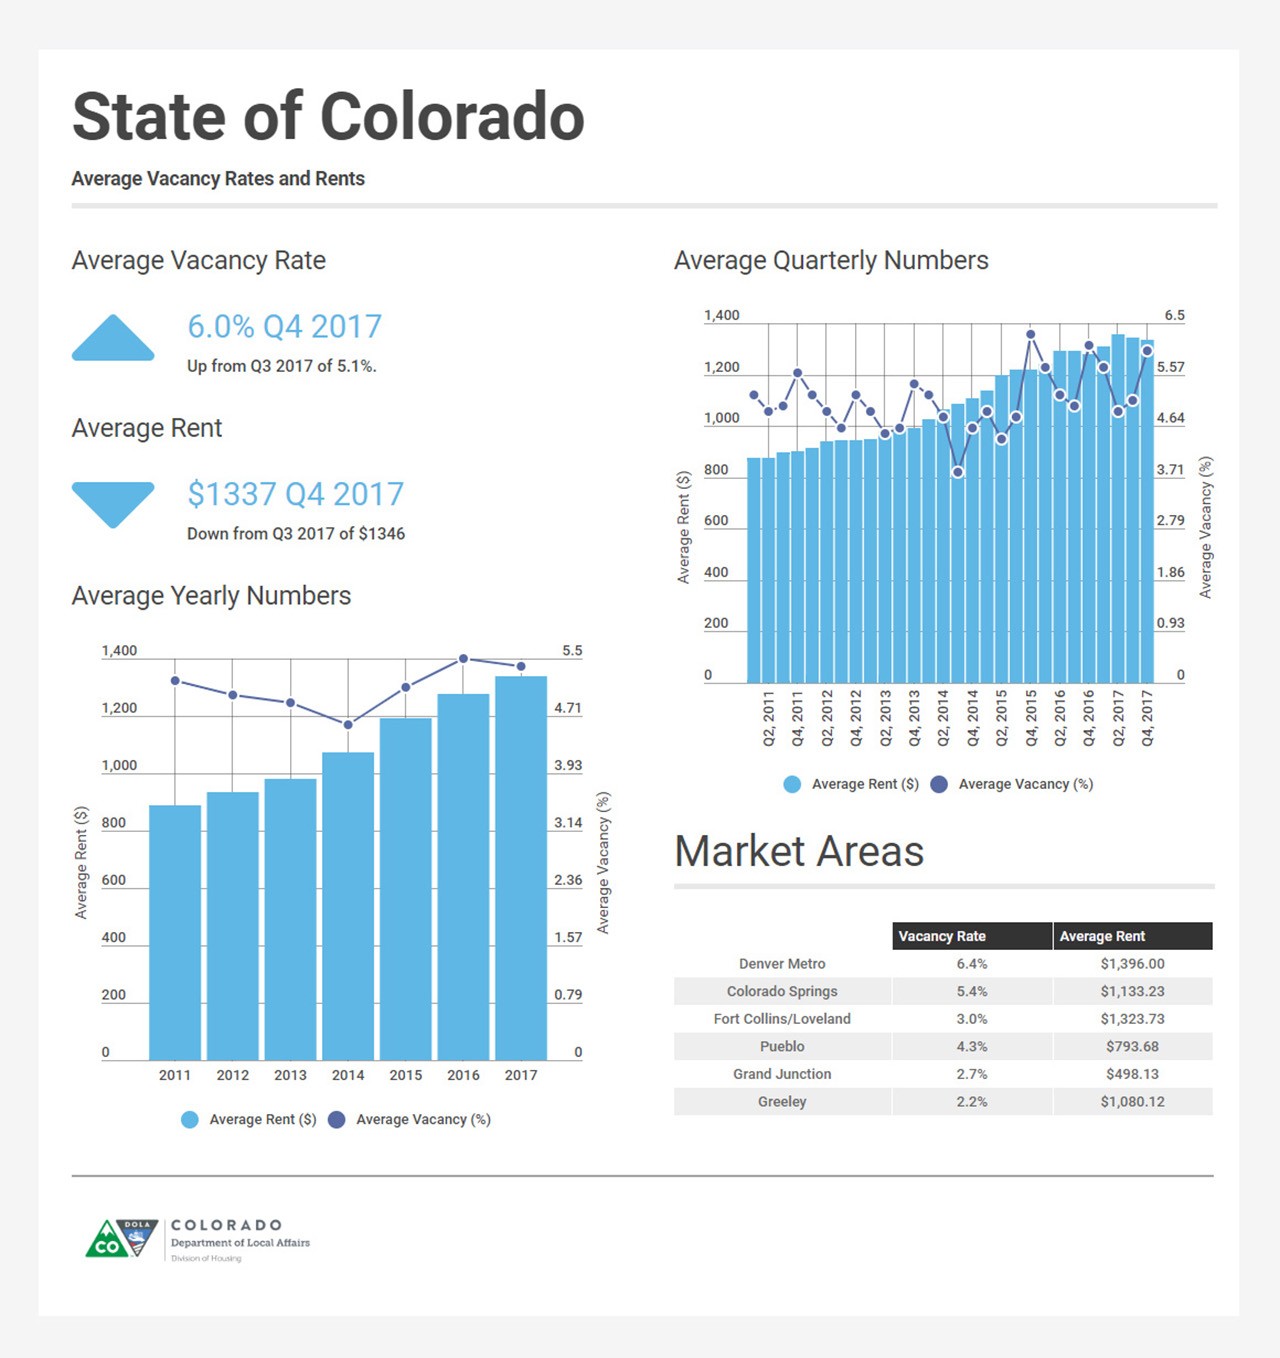
- An interactive data visualization for rent and vacancy data across Colorado - which helped tell the story of Colorado's housing crisis for reporters and the division of housing
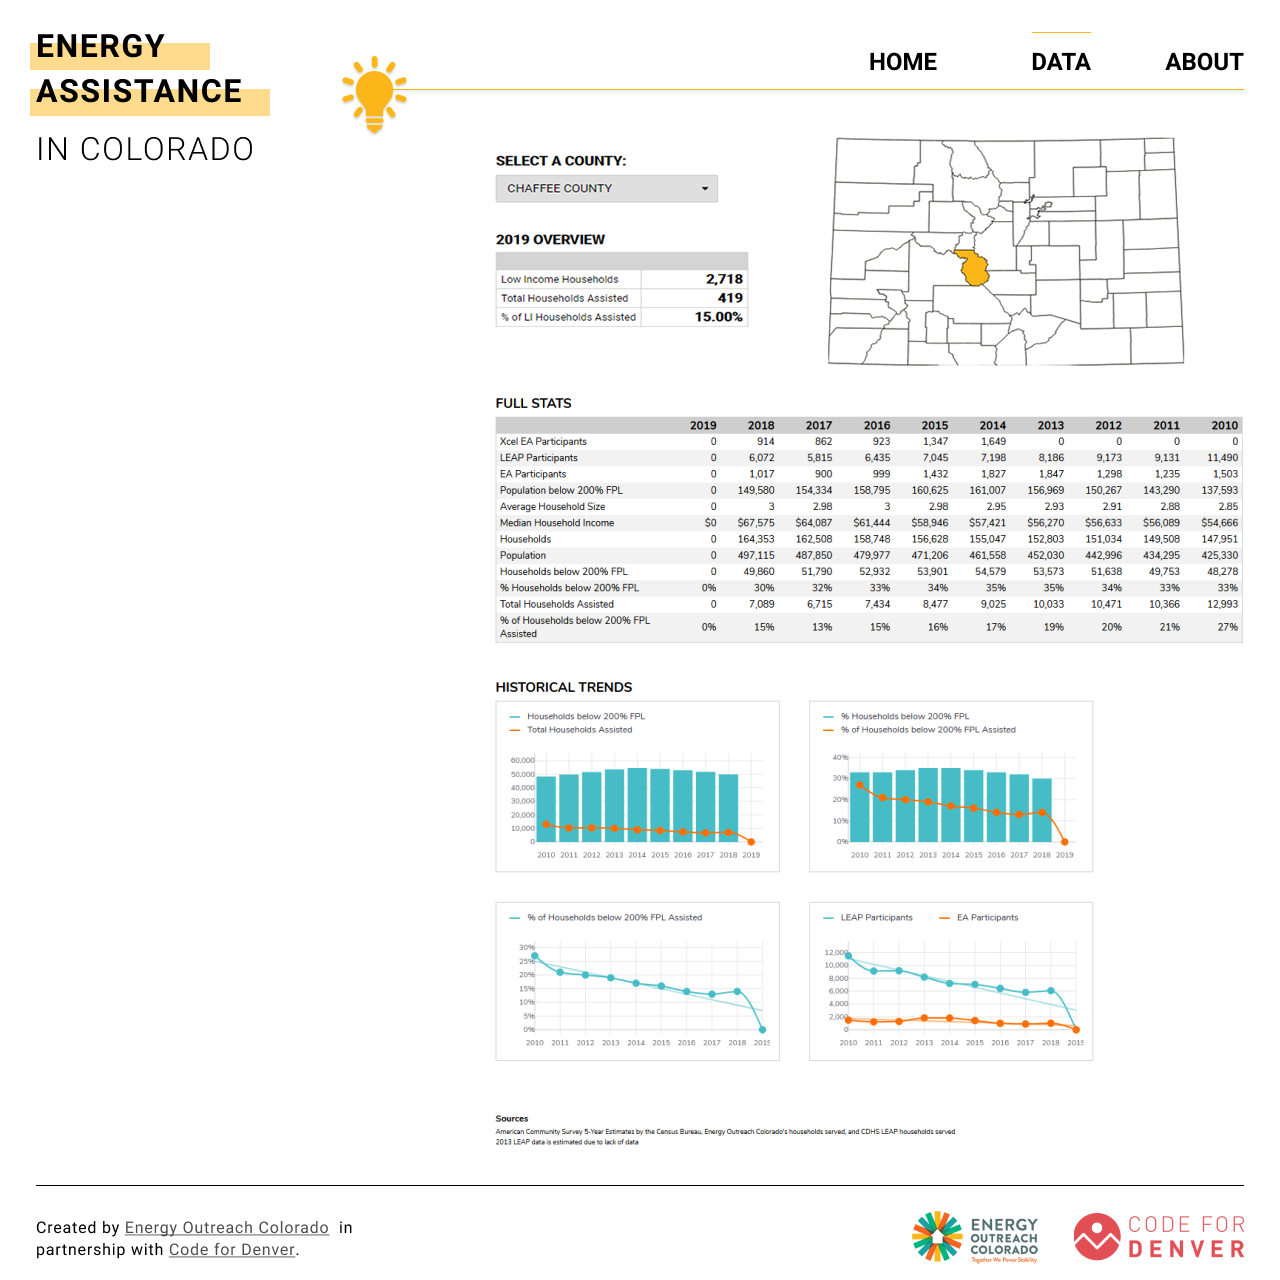
- A web app with an interactive map and table that combined census data, energy assistance data, and public funding data to highlight the change in funding over time at a county-by-county level - this was used to highlight the energy poverty crisis to representatives of those counties in the Colorado Legislature